Power BI Salesforce reports
Gartner predicts that by 2021, CRM will be the single largest revenue area of spending in enterprise software. Why?
Customer relationship management
Customer relationship management (CRM) is a technology for managing all your company’s relationships and interactions with customers and potential customers.
A CRM solution helps you, therefore, focus on your organization’s relationships with customers, service users, colleagues, or suppliers. It follows your lifecycle with them, including finding new customers, winning their business, and providing support and additional services throughout the relationship. CRM, therefore, helps you to improve your business relationships.
To grow your business, you have to set targets for sales, business objectives, and profitability. You will need, of course, reliable information on your progress. You must collect and transform all the data from sales, customer service, marketing, and social media monitoring into valuable business information.
A CRM system can give you a clear overview of your customers. Moreover, all the data are in one place organized in a simple, customizable dashboard revealing customer’s previous history with you, the status of their orders, any outstanding customer service issues, and more.
Data integration platforms
Windsor.ai data integration and data platform (DMP) makes it easy to connect all your data sources and collect desired data. It is quick and straightforward to join and integrate it with other information and use the data together in any other application, marketing platform, or visualization tool. That way, you can focus on the insights gained from the data integrations and run your business rather than spend time on integrating data.
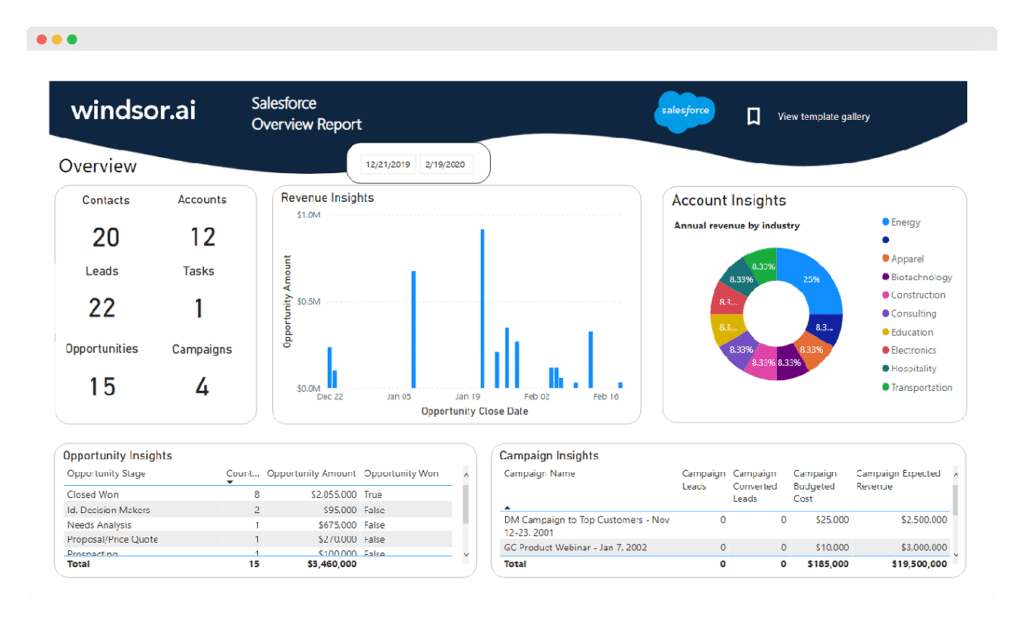
Using their Power BI Salesforce Overview Report template to visualize your Salesforce Contacts in Power BI lets you achieve just that. It will also collect all relevant data from the Salesforce platform and transform them into easy-to-understand visual form.
Power BI Dashboard
Power BI enables the user to transform and also visualize data using intuitive graphics and giving valuable insights. You can then analyze Salesforce data on an object level.
Salesforce data are organized as objects, database tables that permit you to store the data specific to an organization.
This Power BI Windsor.ai report pulls the following objects:
- Account
- Lead
- Contact
- Task
- Opportunity
- Campaign
All objects are queried separately, but you can join them in a single Power Bi Report, add and edit fields and visuals or use the report as it is. It will get you started on your journey to understand better and thus improve your customer relationships.
If you want to know more
For more details about using Excel, Power BI, Windsor.ai platform, and other advanced productivity tools, you can contact me here or request a custom offer on Upwork and Fiverr. It is also possible to have a direct relationship using Payoneer or PayPal. If you have some other preferred option for collaboration, please use this contact form for suggestions.
Share