Excel and Power BI, when I use which and why?
Microsoft Excel is my spreadsheet of choice for more than thirty years now. It has gone a long way since then. Today as a part of office 365, Excel is more than the application that captures data in rows and columns. It is now an integrated suite for all your data analysis and reporting. You can now turn your data into insights.
Power BI, on the other hand, is a business analytics tool. Various software services, apps, and connectors connect your unrelated data sources into interactive insights, superbly visualized, and structured.
The dilemma that arises is when and for what purpose to use Excel, and where it is better to turn to Power BI.
When I use Excel?
Excel is excellent for organizing data, as it understands your patterns and helps you save time. It will help you to get a better picture of your data. Various charts, graphs, and images will help you present your data to stakeholders and convey a clear message. It has Power Query capabilities in recent versions, connecting different data sources and building data models using “M” Language. So, why we need Power BI then?
Power BI
Power BI can connect to excel spreadsheets, cloud, relational databases, NoSQL databases, Data warehouses, flat files, Big Data tools, and much more. The specific structure of Power BI (as a Desktop and as a web service) makes it robust, simple, and fast, and ready for real-time analytics. For that purpose, it uses powerful DAX language. It also works well with mobile devices.
When one ends, and another starts?
Most of the users will use both for their data reporting and analyzing needs.
Excel is a spreadsheet. Unlike Power BI, it is easy to use all kinds of formulas and functions and shape your data tables as you need. It can create macros and even whole programs so that you can process your data. Excel has been an irreplaceable spreadsheet tool for decades, and it is unmatched for all kinds of tabular reports.
You can do advanced data modeling and create graphs and charts. But there, its power stops, and future work is transferred to Power BI.
Power BI is primarily Business Intelligence (BI) and Data Visualization tool and, as such, faster in processing than Excel. It can handle a large amount, unlike Excel.
Power BI dashboards are more interactive and can share dashboards with a large number of users.
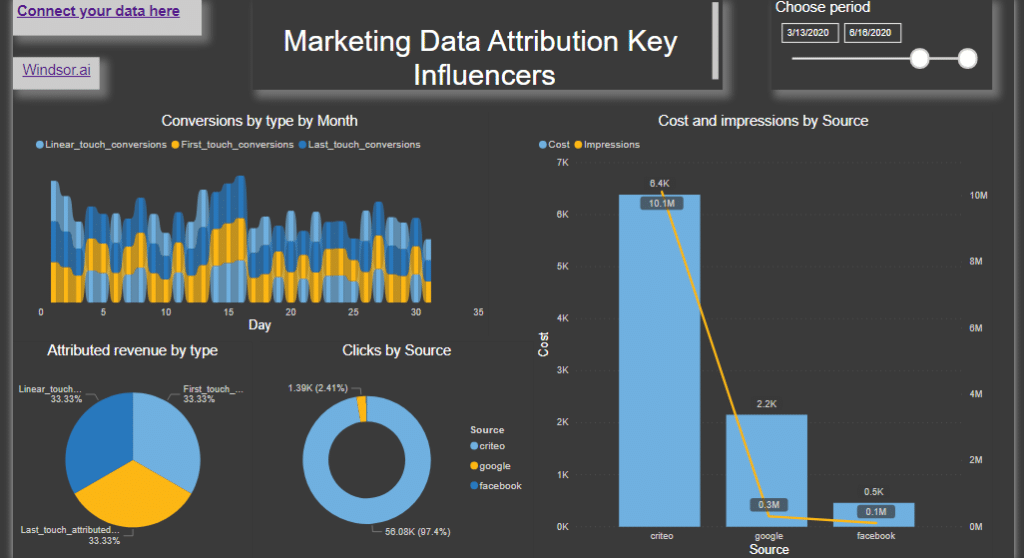
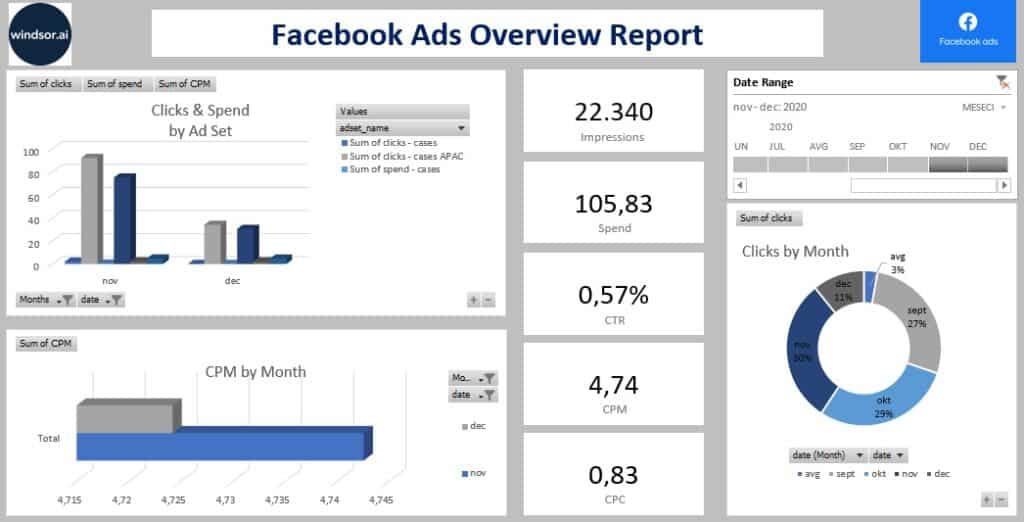
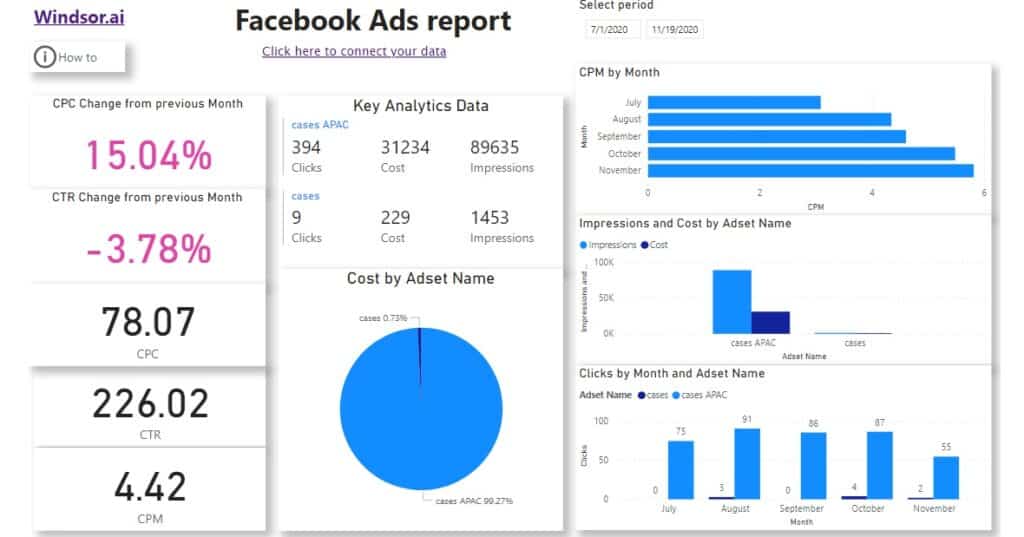
Excel and Power Bi reports comparison
Comparing the two reports, they are the same, except one is created for Excel and another for Power BI. They both use the same connector and data set, analyzing the Facebook Ads marketing campaigns. You can see the differences in practical use, both visually and in handling a large amount of data. Try both and let me know which one suits your needs better.
Fortunately, you can always transfer data from one to another and customize your reporting and analysis process.
If you want to know more
For more details about using Excel, Power BI, Windsor.ai platform, and other advanced productivity tools, you can contact me here or request a custom offer on Upwork and Fiverr. It is also possible to have a direct relationship using Payoneer or PayPal. If you have some other preferred option for collaboration, please use this contact form for suggestions.
Share