Facebook Ads, do we need them?
Facebook is one of the largest social platforms. More than two billion people use Facebook every month. We all know then that it must be the right place for advertisement. You don’t have to be an expert to start advertising on Facebook. You select your objective, audience, and decide where to run your ad. After you set your budget and start running ads, you would like to know how successful is your campaign. Although you can track performance in Facebook Ads Manager, your options are limited. There are other platforms where you can better gather and analyze your data and compare them to how successful your campaigns are at the different platforms you run your ads.
Find out which marketing efforts are contributing to your success.
Attribution means assigning credit to the marketing touchpoints along the customer journey that leads to a conversion or desired action by the customer. By understanding which of your ads get credit, you can better measure your ads’ impact and make future planning and optimization decisions.
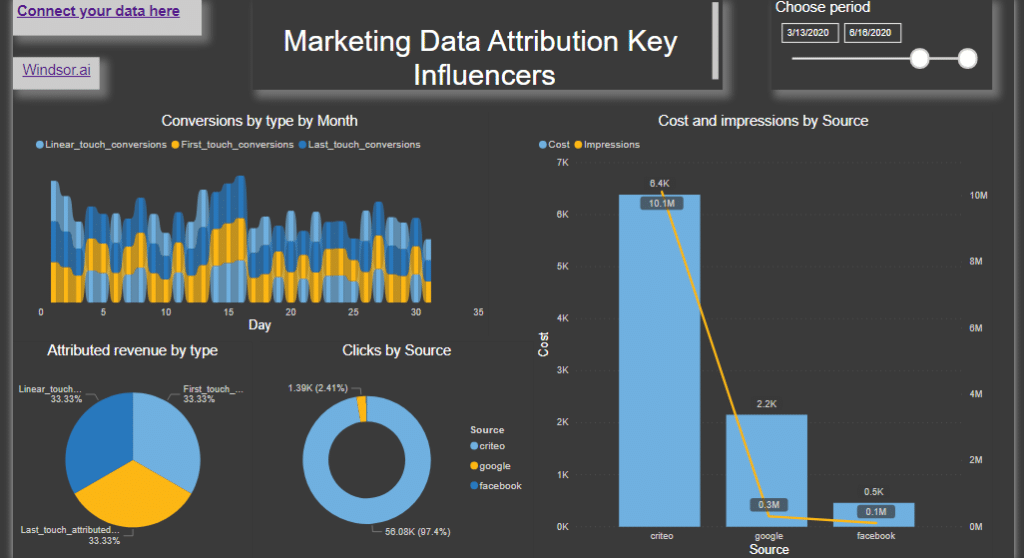
I measure attributions using the Windsor.ai Marketing Data Attribution platform. It is easy to use, intuitive and can connect almost all marketing platforms in one comprehensive dashboard. It also gives you attribution insights using the Customer Data Journey and Markov Data Attribution Model.
The best for me is the ability to use gathered data in my choice tool, and such are Tableau, Power BI, Google Sheets, or my favorite Excel.
Using Excel as a reporting tool
If Excel is your preferred reporting tool, you can use their Excel Marketing Reporting Template. If you’re buying media across channels, this template connects all of your data into a single report. The standard template covers the most common channels and metrics. Modifying it to add additional channels is straightforward and doesn’t take you more than a few minutes.
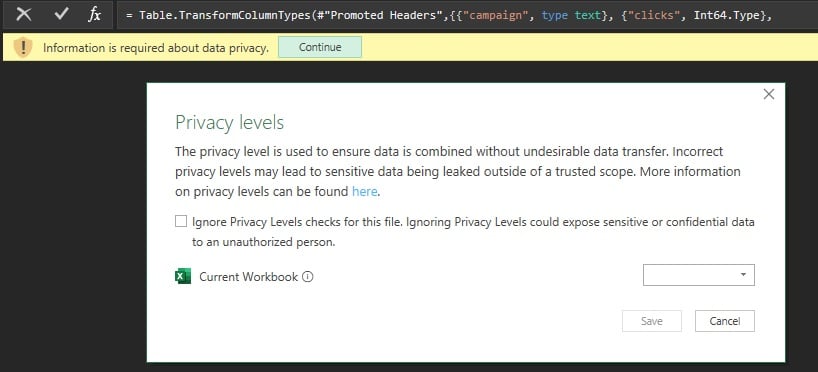
Getting data into excel is easy. In this template, you only need to enter your API key given in the registration process. Depending on your Excel or Office 365 account configuration, you might be asked to provide the privacy level you chose for this file. And that is all.
After you connect your data, you can then customize the charts, add other data sources, or change the report’s style or other features. It is especially true if you are familiar with Data Query editor in the latest Office 365 Excel versions. Your possibilities are unlimited.
And more…

Bonus Tip: Now, you can successfully connect your data to a PDF as well. Often you need to have data from external reports that are made in PDF. You can select PDF as a source in the “Get Data,” “From File” option, and choose the document’s table. Sometimes you will need to transform some data, but that is the case in other data sources anyway.
Conclusion
Tools you use to keep track of your advertising campaigns are essential for you to decide on the next steps in your Customer acquirement and retention. But, always keep in mind that your insights and continued involvement are necessary to get to the top. Choosing the right tool will help you a lot, but you have the final word, as always.
Further steps
It is just the beginning of the Excel reports journey. Please let me know if this article about Facebook Ads and connecting your marketing data in Excel was clear enough and if I provide you with the information you need to connect to your data using a third-party vendor template. I will be happy to update this article with the necessary details. Also, you can find more information on my blog.
Share