Power BI Desktop app is an excellent way to present and visualize your marketing data to upper management. Suppose you are using your own data source or using some advanced marketing data attribution platforms. In that case, you can use Power BI’s power to make the best impression to help drive business decisions. Companies like Windsor.ai have made various templates to help you create such reports.
Using templates
Templates are meant to be used primarily in Power BI Services and Office 365 based web app with collaboration features. However, some companies still do not let their employees use web services to process business data. Despite all the security features built inside such applications. We will discuss those security concerns later in this article. But, for now, there is a solution to get to those tempšletes, downloading a .pibx version. That way, you can securely have a template that you will use only in your Power BI Desktop environment.
As I understand, Power BI Desktop is still a choice for many over Power BI Services. I am sure that this will change as more people accept the Office 365 platform concept. Anyway, here are .pibt template files you can use. You can start using your marketing data attribution reports for Power BI Desktop.
- Multichannel Attribution Dashboard
- Media Overview Report
- Google Search Console overview
- Facebook Ads Overview Report
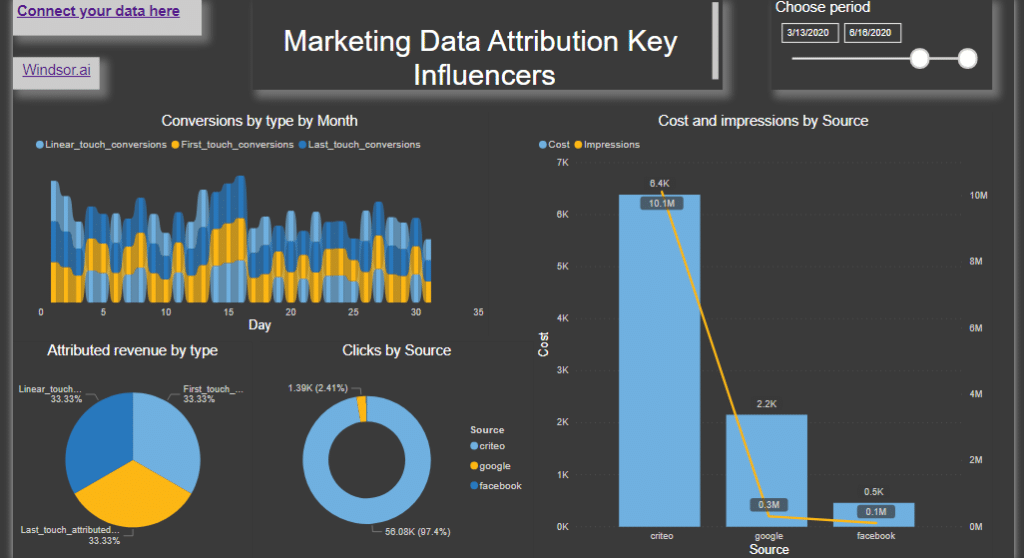
Multichannel marketing data Attribution dashboard provides simple insights about paid and non-paid media performance. You can see top-level data from all your channels
- Google Ads
- Facebook Ads
- LinkedIn Ads
- Bing Ads
And understand their contribution to your marketing goals.
It includes reporting on all channels on a Channel Groupings level. It makes it easy to understand for everyone (especially for non-technical users). You can customize those reports to suit your marketing strategy.
Power BI Desktop vs. the Power BI service
Power BI is an online software service (SaaS, or Software as a Service). It lets you easily and quickly create self-service Business Intelligence dashboards, reports, datasets, and visualizations. With Power BI, you can connect to many different data sources and combine and shape data.
In a Venn diagram comparing Power BI Desktop and the Power BI service, the middle area shows how the two overlap. Some tasks you can do in either Power BI Desktop or the service. The Venn diagram’s two sides offer the features that are unique to the application and the service.
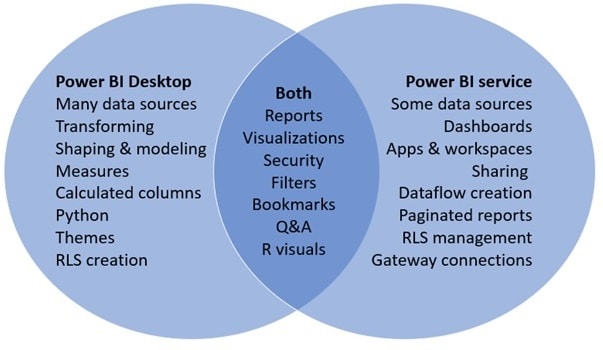
Power BI Desktop is a complete data analysis and reports creation tool. You can install it for free on your local computer. It includes the Query Editor, in which you can connect to many different sources of data. Moreover, you can combine them (often called modeling) into a data model. Then you design a report based on that data model.
The Power BI service, on the other hand, is a cloud-based service. It supports light report editing and collaboration for teams and organizations. You can connect to data sources in the Power BI service, too, but with limited modeling features.
The usual way to use Power BI Desktop is first to create Power BI reports. Afterward, you can use the Power BI service to collaborate and distribute the reports.
Collaborating
Workspace in the Power BI service is a place where you and your colleagues collaborate. You can build dashboards that summarize your reports and share them inside your organization to applicable persons. Your report consumers view them in the Power BI service in a Reading view, not Editing view. They don’t have access to all the features available to report creators. However, you can also explicitly share your datasets. That way, you let others build their own reports from them if you choose to do so.
Power BI Security
The Power BI service is built on Azure, which is Microsoft’s cloud computing infrastructure and platform. Power BI uses the Azure Active Directory (AAD) to store and manage user identities and manages the storage of data and metadata using Azure BLOB and Azure SQL Database, respectively. Platform security for Power BI also includes multi-tenant environment security, networking security, and the ability to add additional AAD-based security measures.
However, it’s important to note that users are responsible for the data they share. If a user connects to data sources using their credentials, then shares a report (or dashboard, or dataset) based on that data, users with whom the dashboard is shared are not authenticated against the original data source and will be granted access to the report. An exception is connections to SQL Server Analysis Services using the On-premises data gateway. Access will only be granted if the user has sufficient credentials to access the data.
Publishing reports and data to your Power BI account is secure, as described in the Power BI security whitepaper.
Once you’ve published a report to your Power BI workspace, you can share that report with other Power BI users if you want, and that is secure. However, if you use “Publish to web” that publishes your report to a publicly facing web site (app.powerbi.com). Use this option only for the reports meant for public use, with demo data or those you want to share with everyone.
Conclusion
The use of Power BI tools in any version, Desktop or Services, is an excellent way to improve your data reporting. Also, using some specialized BI platforms like Windsor.ai is a way to have your marketing data well structured, with some AI insights, and ready to be used with provided templates, which you can easily customize.
Service I provide
Please contact me with your idea or existing service to make a custom offer just for you, and start this journey together.
I am committed to long term relationships and gaining your trust.
For more details about Power BI and marketing data reporting, you can contact me here, or request a custom offer on Upwork and Fiverr. It is also possible to have a direct relationship using Payoneer. If you have some other preferred option for collaboration, please use this contact form for the suggestions.
Share